Locker Associates, Inc.
Consulants to the Business World Since 1981
LOCKER ASSOCIATES
Locker Associates specializes in strategic research, financial analysis and comprehensive planning to help clients navigate difficult business situations. We bring to our clients a deep understanding of how businesses and industries work. We helped countless industrial and private-sector unions deal with deindustrialization to preserve work by managing difficult change, as well as founding employee-owned firms.
Over the last 40 years we have directed more than 250 strategic efforts in support of organizing, bargaining, plant closure aversions and other initiatives spanning the construction, transportation, distribution, manufacturing, service and public sectors.
Locker Associates has served as a steel and steel-related industry expert witness in multiple court and arbitration cases for a variety of clients.

OUR SERVICES
Our combination of strategic acumen and financial and business expertise makes us uniquely qualified to serve clients by:
— representing clients as an expert witness across a vast majority of industries, including all major metals (steel & steel-related, aluminum, copper & iron), manufacturing, warehousing, trucking, manufacturing and many others;
— conducting in-depth forensic research of industries and businesses, identifying sources of leverage and helping clients design powerful campaigns for a myriad of causes;
— strategic planning and workplace reorganization of businesses in bankruptcy;
— facilitating ownership transitions to secure the long-term viability of a business;
— leading joint labor/management business improvement initiatives;
— preparing comprehensive campaign plans for community-based groups seeking to use leverage to organize for progressive change.

Michael Locker

Michael Locker is founder and President of Locker Associates, Inc., a NYC-based business consulting firm that specializes in corporate restructuring, expert witness testimony, buyouts, feasibility studies, developing business plans and performing due diligence. As a recognized authority on reorganizing troubled companies, Mr. Locker often representing employees in such efforts.
Major clients have included trade unions (United Steelworkers, Machinists, United Auto Workers and the International Brotherhood of Teamsters), financial institutions (Bank of Boston, Lazard Freres, Congress Financial, Santander Investment), law firms, bankruptcy trustees and government agencies.
Mr. Locker has also acted as an expert witness in various court proceedings, including testifying before the U.S. Congress.
Robert Howlett

Robert Howlett is an Associate with over twenty five years of labor-related experience. Since joining Locker Associates in 1998, Mr. Howlett has worked on projects related to the competitive prospects of companies in many industries, including construction, warehousing and transportation.
Mr. Howlett has worked on projects involving trucking for the International Brotherhood of Teamsters, as well as an organizing campaign in Atlantic City for the American Federation of Musicians. His work on these projects has included extensive industry research, market analysis, labor and management interviews and development of reports and presentations.
June Liu

June Liu, Associate, is a dynamic finance professional with a graduate degree in Economics from Johns Hopkins University and a dual degree in Finance and Hospitality focusing on lodging and real estate from the University of Denver. Her expertise spans acquisitions, fundraising, and consulting, with a proven track record in both Hong Kong and the U.S. This international experience provides June with a valuable global perspective in financial markets and strategic business operations. Her analytical skills and innovative approach earned her top honors in the Hotel Asset Managers Association Case Competition and the Fritz Knoebel Leadership Excellence Award in 2021.
Combining academic excellence with hands-on experience across diverse markets, June excels in delivering valuation-enhancing activities through strategic, financial, and operational improvements, driving effective decision-making initiatives to optimize financial performance in complex, multicultural environments.
Our Services
Locker Associates is a New York City based business-consulting firm that specializes in enhancing the competitiveness of businesses and industries on behalf of union, government and corporate clients. By combining expert business and financial analysis with a sensitivity to labor issues, our firm is uniquely qualified to help clients manage change.

LABOR/MANAGEMENT
Leading joint labor-management business improvement initiatives

STRATEGIC INDUSTRY STUDIES
Conducting strategic industry studies to identify future challenges and opportunities

CORPORATE CAMPAIGNS
Representing unions in strategic planning for campaigns

BUSINESS PLANNING
Formulating business plans for turnaround situations

OWNERSHIP TRANSITION
Facilitating ownership transitions to secure the long-term viability of a business
Over the last 30 years, our firm has directed over 300 projects spanning manufacturing, transportation, distribution and mining industries. Typical projects involve in-depth analysis of a firm’s market, financial and operating performance on behalf of a cooperative labor-management effort.
Our Projects
Expert Witness (2024-2025): retained as a steel industry expert witness in an arbitration case which require a written industry report, a multi-session deposition and testimony in court
United Auto Workers (UAW) (2024): presented a report on special bar quality (SBQ) steel industry, including prices, shipments, employment and latest developments, as well as the financial and competitive condition of U.S. and foreign SBQ steelmakers
Association for Delivery Drivers (A4DD) (2023-2024): provided strategic consulting services to increase membership by mapping the independent delivery driver industry and recruiting new firms
Center for Migration Studies (CMS) (2019-2023): through extensive interviews, CMS and Locker Associates performed a comprehensive study of immigrants in the construction industry in NYC to shed light on working conditions and how they connect to their co-workers (both immigrant and non-immigrant) in their workplaces and communities
Unite the Union (2020-2022): retained to perform strategic research on corporations on a tight deadline basis to support Unite’s efforts to avoid conflict and to help secure labor agreements
International Union of Electrical Workers (IUE) (2021-2022): research two General Electric plants, Lynn, MA & Schenectady, NY (the original GE manufacturing facility) to assist the IUE in finding ways to save jobs at the two plants
Workers United (2020): assist in researching the Michigan, Illinois and Colorado cannabis industry to learn more about the regulatory environment, the industry’s structure and the dynamics of growing legal cannabis
Blue Planet (2020-2022): tasked with introduction to Local and International unions to the company which specializes in green technology and environmentally-friendly manufacturing processes
Workers Equity (2021-2022): retained by Workers Equity to research semi-conductor maker On-Semi on behalf of the International Union of Electrical Workers
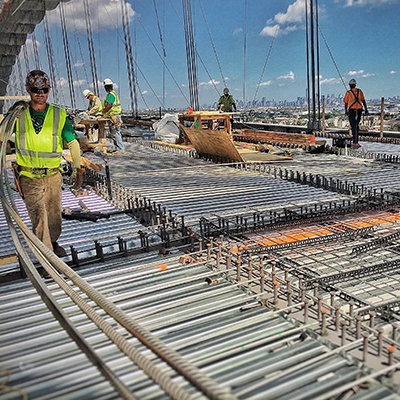
Metallic Lathers and Reinforcing Ironworkers (2010-2020): strategic industry research and on-going advisement on major industry trends and companies to help enhance the competitive position of the unionized NYC construction industry
Painters & Allied Trades District Council 9 (2018): research and analysis of major New York City interior contractors to support union organizing efforts
New York Professional Nurses (2018): strategic research and analysis of a New York City hospital (and its regional parent health system) in support of NYPNU’s contract negotiations
Building Trades Council of Westchester and Putnam Counties (2017-2023): provided in-depth research and analysis of current and future residential construction projects in Westchester and Putnam Counties to support the BCTC’s efforts to secure work for their members
Elevator Industry Work Preservation Fund (2016-2020): research to determine if elevator and escalator injuries and deaths declined after states implemented legislation that strengthens safety specs for construction and/or maintenance of elevators and escalators
New Jersey Advisory Council on Safety and Health (NJCOSH) (2016-present): restructure membership database from a traditional computer-based tracking method to a well-organized web-based system to efficiently track dues, collection of PAC donations and retain members
MyChange-Business Plan (2017-2025): negotiated a deal to purchase a web-based start-up company that was developed to help donors support their favorite charities by rounding-up electronic purchases which creates “virtual spare change” that can be easily donated
Build Up NYC (BUNYC)-Strategic Research (2012-2016): directing research efforts for an NYC multi-industry union coalition, composed of Building Trades, Hotel Trades and SEIU 32BJ which promotes responsible real estate development
Communication Workers of America (CWA)-Franchise (2015-2017): research and analysis on cable franchise agreements to determine the feasibility of including labor standards
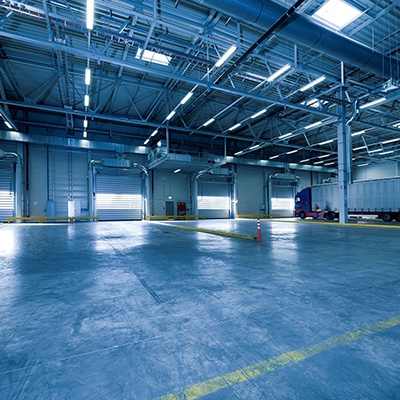
Worker’s United/SEIU (2014): prepared and presented a detailed study on distribution and warehousing in the apparel industry, including profiles of several major apparel retailers
Communication Workers of America (CWA)-Cablevision (2012-2015): develop campaign material, including a Wall Street analyst presentation to support contract negotiations
United Auto Workers-Steel Industry Presentation (2013): presented status report to the UAW Steel Council composed of local union representatives from steel-related firms
In The News
Locker Associates

U.S. Steel CEO Faces Tough Choice Between Costs, Investment
Locker Associates Presentation UAW Steel Council, 2017
Construction Unions Grip on NY Starting to Show Cracks